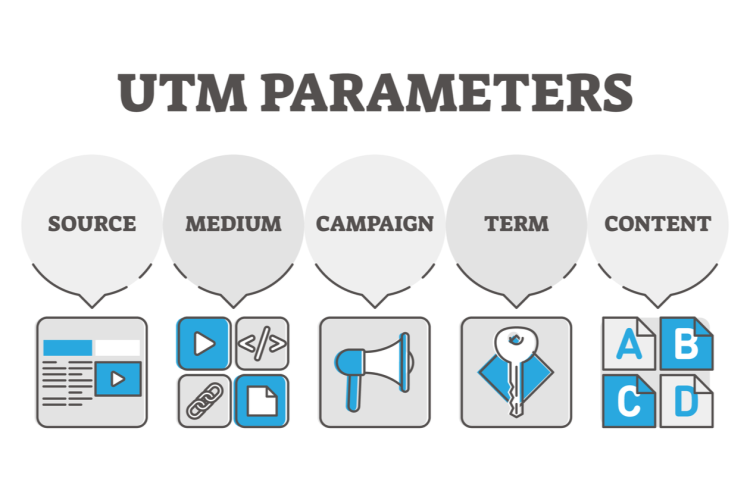
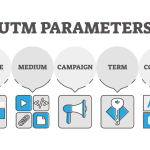
What is google data studio?
Google Looker Studio (formerly Google Data Studio) is a free dashboard creation tool that allows you to create visually appealing, customizable, interactive, and responsive dashboards. Panels could be built from templates, the most diversified graphs, maps, and tables can be used, your brand identity can be applied, and other resources can be used — all in a user-friendly manner so that anybody can make and understand the reports. Google Data Studio collects measurements and indications that help decision and strategy-making through data visualization, allowing businesses to take fewer risks and achieve their objectives.
What is google data studio?
- It’s a Free tool: Looker Studio is a FREE tool that is accessible and convenient for anyone to use.
- Dashboard with customizable reports: Looker Studio grants users the ability to generate custom reports with an extensive range of designs, styles, formatting, and graphs. Pre-designed templates can be useful if you are new to Looker Studio
- Contemporary & Interactively connected Data Visualizations
- Automated Reports with Real-Time Data: Manually formatting reports and exporting data can become very time-consuming. Google data studio helps you to have automated routine reports in lesser time.
- Dashboards which you can share: Looker Studio has report allocation and distribution and collaboration features that establish streamline communication among your users and business partners
- Looker Studio Exports: The moment you accomplish creating your report dashboard, you can export it to the following documents: Email, Google Sheet, Excel, PDF
- Connects to Multiple Data Sources
- Filters tools: campaign, account, location, date range, etc
- Fields for calculation: Basic math, Functions for statistical operations) case statements
- Drill Down Capabilities: Looker Studio empowers you to drill down into your data all within a single element
How to use Google Looker Studio in 5 simple Tips
- Sign up for Looker Studio
To access Looker Studio, you’ll need a Google account, preferably the same one you use for Analytics, Search Console, and/or Google Ads. It is also possible to import third-party data.
- Use the Looker Studio dashboard
Dashboards are great ways to visualize numbers and create something stunning. In Google Looker Studio you can choose from several templates or start your work from the beginning. We have a pretty good blog post about how to build a dashboard if you want to check it out.
- Connect your data and create a report
You can directly connect your data to Google Looker Studio from Analytics or Search Console After this, you can create a report very easily.
- Add some charts and graphs
You can find loose numbers to be somewhat boring and even perplexing. Google Looker Studio therefore tries to break this data into simpler components that produce data for graphs and tables.
- Share the report when it is ready
If you feel satisfied with the results, then you can share your report from Google Looker (Data) Studio.
Author
Yunus Babasoylu
05/08/2023v